

Detecting Business Fraud with Our Enhanced M-Score Tool
By Tyson Slesnick, CFE, Forensic Data Analyst
If fraud came to visit your company, what might it look like? Perhaps its cloak of deception and a sly grin would give away its true motives. If only fraud was personified in such a way, our jobs would be much easier and fraud would go the way of the dodo.
Unfortunately, fraud tends to be subtle. When it finally comes to light it’s more like a bolt out of the blue than a slam dunk. But what if fraud didn’t just come out of nowhere? What if it gave off signatures or other indicators of its presence? The Beneish M-Score is such a tool that might offer a clue. Like Benford’s Law, the Beneish M-Score gives fraud fighters like us another arrow for their quiver.
Read on to learn about the value of this tool and how our team has taken it to the next level to find insights for clients.
What it Does
The Beneish M-Score* is a robust mathematical model that attempts to detect profit manipulation and other forms of financial statement fraud. In addition to its power in fraud detection, the M-Score can also be used in disciplines such as internal auditing, risk management and portfolio management to improve the decision-making process.
It may even have the ability to predict recessions by shedding light on a company’s liquidity and other areas of financial strain. Additional research is currently being conducted to assess whether aggregations of M-Scores can point to potential recessions. As part of our research, our team sampled many U.S. companies (across many years) and found several with suspected financial statement manipulation. Earnings manipulation remains a concern in today’s business environment.
How it Works
At its core, the Beneish M-Score weighs a collection of factors that span all of the financial statements. These factors are then aggregated and compared to a threshold that helps to determine whether earnings manipulation is likely. The key inputs include:
- Accounts Receivable
- Cash From Operations
- Cost of Goods Sold
- Current Assets
- Current Liabilities
- Depreciation Expense
- Long Term Debt
- Net Income
- Net PPE
- Sales
- SG&A
- Total Assets
For the mathematically inclined, the M-Score can be calculated as follows:
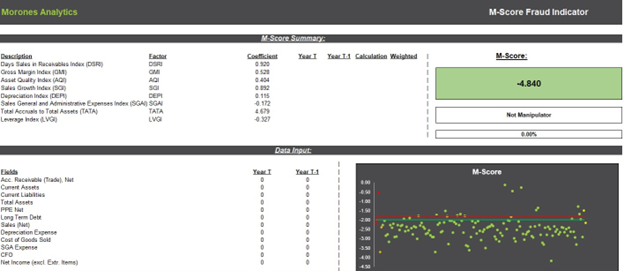
M-score = −4.84 + 0.92 × DSRI + 0.528 × GMI + 0.404 × AQI + 0.892 × SGI + 0.115 × DEPI −0.172 × SGAI + 4.679 × TATA − 0.327 × LVGI
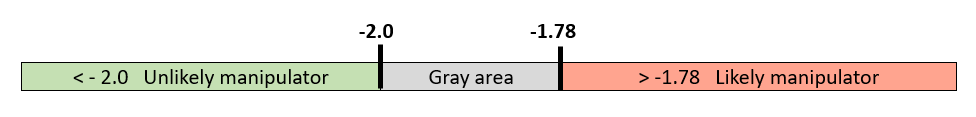
Each three or four-letter acronym in the above equation is a ratio using various combinations of the inputs listed above. The final summed result is then compared to thresholds ranging from -1.78 to -2.0. Values less than -2.0 are unlikely manipulators, values greater than -1.78 are likely manipulators and values in between are a gray area.
How We’ve Enhanced This Tool to Find More Insights
While the M-Score has been around since 1999, created by Professor Messod Beneish, the Morones Analytics team has used it to build out more robust analytics capabilities for clients. In addition to getting answers to potential fraud questions much faster and more efficiently, the team has used data visualizations and time series analysis built on top of this model to supercharge our analytical procedures in fraud investigations.
We see several areas where we can use this model to directly benefit our clients:
- The model can serve as an efficient initial assessment that can help set an agenda and answer pressing questions faster
- We can identify key areas on the financial statements that look suspicious, allowing us to scrutinize certain financial statement accounts where we need to zero-in on potential issues
- Aggregation provides a good basis of comparison to help establish what looks normal across industries and sectors
A sample depiction of the Morones Analytics model.
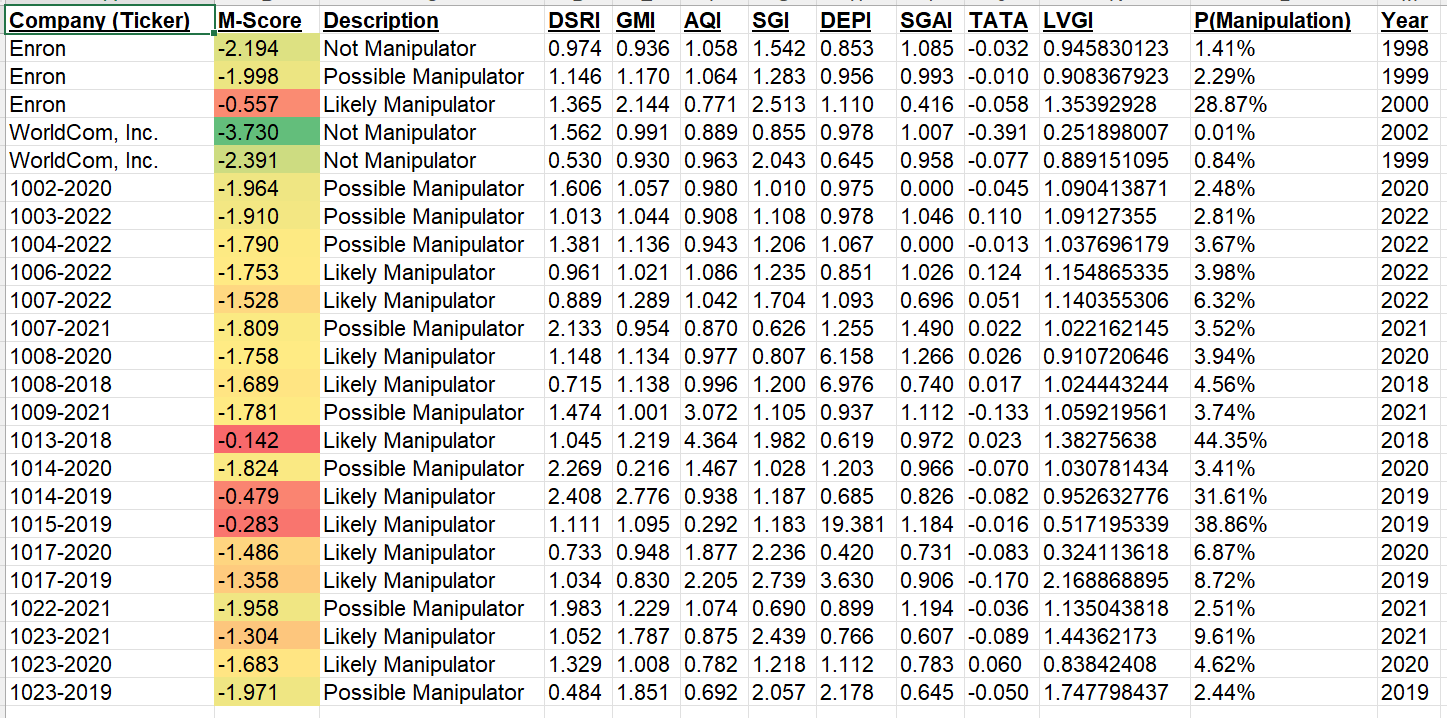
A graphical depiction of companies surveyed in the Morones Analytics study (data spanned from 2017 to 2022).
Red dots = Enron, Yellow dots = WorldCom and Green dots = Morones Analytics sample Pacific Northwest companies.
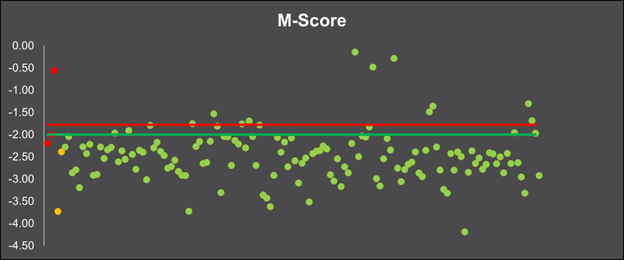
Out of 24 companies in the Pacific Northwest, using 135 data points, 8% were flagged as likely earnings manipulators, 6% as possible manipulators, and 86% not manipulators per the Morones Analytics study. The indicator for WorldCom serves as a reminder that models are not bulletproof with regard to the identification of fraud.
Fraud Monitoring and Prevention
An ounce of prevention is worth a pound of cure. Ongoing fraud monitoring can drastically reduce costs that might rear their head down the road. Finding fraud in its early stages can drastically reduce the scale of financial damage.
Taking a proactive approach to monitoring also shines a light on areas of a business that might be more prone to manipulation. Tracking these metrics through time starts to give you a profile of how “normal” may or may not look.
Although the M-Score may not be 100% foolproof, our team ultimately sees it as a reliable tool to help navigate risk as it relates to reported profits and other key measures of financial performance. While we might not be able to guarantee an act of fraud has occurred (false positives or negatives are always a possibility), we can use our enhanced version of the tool to detect fraud in the first place.
* Beneish M-score is a probabilistic model and cannot detect manipulation of earnings with 100% accuracy.
————————————————————————————————————————————
Learn more about our Data Analytics capabilities and team, and how we help bring your litigation strategy into focus.


